The Nifty Seven (Jan 2024)
“The only thing we know about the future is that it is going to be different.”
Dr. Peter Ferdinand Drucker
Speculative excess in the market is well-documented and can be traced back centuries. It is exciting to be part of the action. It is fun. It feels good. But like a wave cresting, gravity eventually takes over, dragging down both prices and investor morale.
“Men, it has been well said, think in herds;
it will be seen that they go mad in herds,
while they only recover their senses slowly, one by one.”
– Charles MacKay
In 2022, it was men recovering their senses one by one that tamed some of the wildness of 2021. Prices of non-fungible tokens (NFTs), crypto, meme stocks, and real estate in the clouds can only be explained by the greater fool theory. Unfortunately, the last to the party in these markets are not treated kindly. NFTs had a monthly trading volume of $2.8 billion during the peak of the NFT craze in 2021; today, nearly 80% of NFT collections are unsold, and fewer than 1% command a price higher than $6,000, far below the most expensive sale of the 2021 mania, a $69 million piece by digital artist Beeple. Meme stocks were down more than 60% in 2022; GameStop, the epitome of the meme craze, fell more than 80% peak to trough, while Bitcoin fell 75%.
Where did these “investors” go in 2023? Surely not back into the same speculative trap that caught them the first time? Well…the good news is that not everybody suffers from short-term memory loss. Many investors today are at least considering the possibility that the return of capital is not a sure thing. As of September 2023, the U.S. was facing the longest decline in the 10-year treasuries since 1787. While this may have jolted investors awake from dreamland, the fourth quarter seemed to contain a heavy dose of melatonin. We are back in the land of Nod, and risk is back on.
The strangest things are there for me,
Both things to eat and things to see,
And many frightening sights abroad
Till morning in the land of Nod.
-Robert Louis Stevenson, “The Land of Nod”
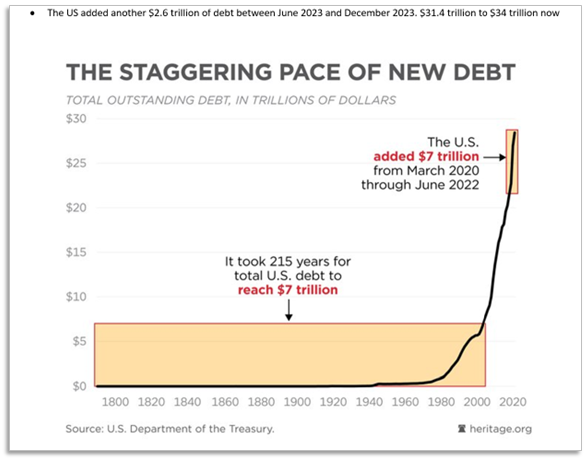
The Federal Reserve is caught in a bind. Despite raising rates at a record setting pace, inflation, as measured by the CPI, has remained stubbornly positive (yes, lower than in 2022, but still positive and higher than the “benign” 2%). The Fed can’t lower rates in the face of high inflation, yet the higher rates are beginning to bite. To paraphrase David Einhorn, 15 years of artificially low interest rates have financialized our everyday life; many aspects of the economy are leveraged and need low rates to survive. The easy money environment has left us with an osteoporotic skeleton, fragile and susceptible to missteps. U.S. debt-to-GDP is 126%, higher than the previous record of 119%, set during World War II. Once future entitlements are factored in, debt-to-GDP is estimated to be north of 380%.
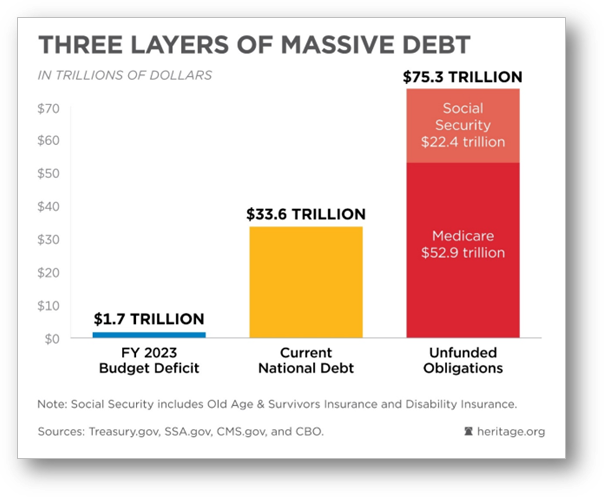
The U.S. has amassed so much debt that at current interest rates, interest expenses alone comprise 14% of the tax revenues. If the government was a business, we would be leery. Credit ratings, which unfortunately tend to be lagging indicators, were lowered this year. And yet nowhere do we hear of cutting actual spending; even wearing the rosiest colored glasses, the U.S. is set to run deficits north of $2 trillion for the foreseeable future. How will we finance these deficits? What if other countries refuse to buy our debt? If the Fed is not buying, can they really control interest rates?
These are big question marks, and the answers could have massive implications for asset prices. Remember Einhorn’s comment.
The crowd has decided the best way to navigate these choppy waters is to focus its attention on the “good” companies with wide “Buffett” moats: the asset light, quality compounders. The ones that should do well in a hard landing, soft landing, or the most recently added no-landing scenario. How magnificent! Who wouldn’t want that?
Maybe “nifty” is another adjective to describe how investors are viewing the current market. How remarkable that the investor behavior we are seeing today mirrors the early 1970s when investors, after losing significant amounts of money in the 1968-1970 bear market, fled to “safety” in the “quality growth stocks,” the “one decision stocks,” also known as the “Nifty Fifty.”
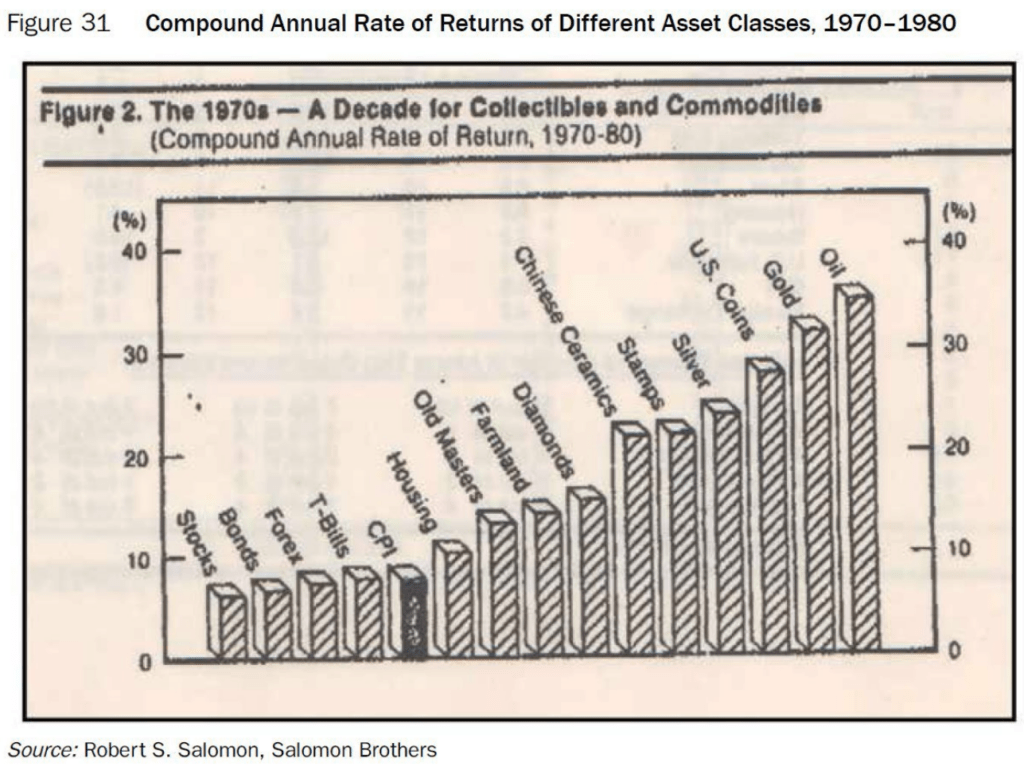
We at Kopernik believe that history is one of the best investment guides around, and we think it is worth spending some time on the decades and years prior to the Nifty Fifty collapse to understand the context. Marc Faber’s excellent write-up of the 1970s was the source of much of the content to follow. We summarize here; however, we encourage our readers to look up the full piece (the November 2021 issue of Faber’s Gloom, Boom, and Doom Report).
1949-1970
To paraphrase Faber, stocks were very inexpensive in the years following WWII; in the late 1940s for example, stocks yielded roughly 3 times more than treasuries. In real terms, the Dow was the same price in 1949 as it had been in April of 1899. Fearing another post war depression, no one was interested in stocks. Investors had lost 90% of their money in the 1929-1932 crash and were positioned very conservatively. Yet, post WWII, the U.S. became the most powerful economy in the world and faced almost no international competition as two of its biggest competitors, Japan and Germany, were in shambles from the war. Economic growth in the U.S. was strong, and a bull market began to form in the early 1950s, gained steam in the 1960s and triple topped in 1966, 1968 and 1972.
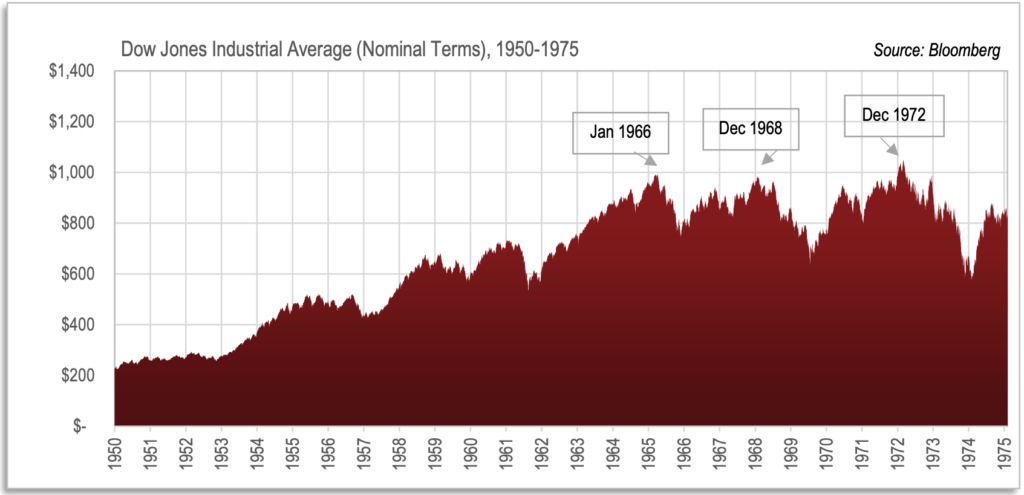
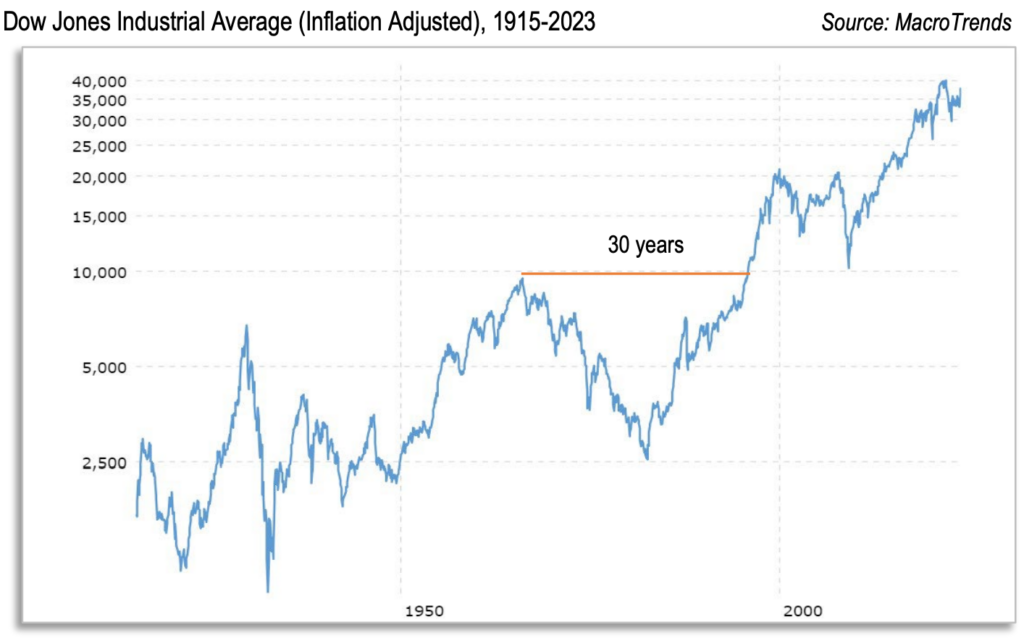
Between 1949 and 1972, the stock market, as measured by the DJIA, was up more than 700%; 9% compounded annually. What followed was a long and painful bear market; in nominal terms, the 1972 peak was not exceeded until late 1982, 10 years of no returns and high inflation! In real terms, 1966 was the peak and it wasn’t exceeded until 1996, 30 years of making essentially no money when inflation adjusted (not including dividends)!
Important for investors today to think about was the change in leadership that happened underneath the surface between 1966-1973.
In the early 1950s, the market loved the economically sensitive stocks as demonstrated by U.S. Steel, which peaked in 1959 (subsequently not exceeding its high until 2008), followed by the SBICs (small business investment companies), the equivalent of the SPAC companies that were all the rage in 2021.
By the early 1960s, years into the bull market, we entered the first wave of speculative froth. When reading anecdotes of the 1960s, one cannot help but make the comparison to the wild times of 2021. To wit, Jack Dreyfus, founder of the Dreyfus Fund, writes of the 1960s:
“Take a nice little company that’s been making shoelaces for 40 years and sells at a respectable six times earnings ratio. Change the name from Shoelaces. Inc. to Electronics and Silicon Furth-Burner. In today’s market, the words “electronics” and “silicon” are worth 15x earnings. However, the real play comes from the word “furth burners” which no one understands. A word that no one understands entitles you to double your entire score. Therefore, we have six times earnings for the shoelace business and 15 times earnings for the electronic and silicon, or a total of 21 times earnings. Multiply this by two for the furth and burners and we have a score of 42 times earnings for a new company.”
The “tronics” boom of the early 1960s, called such since the stock offerings “included some garbled version of the word ‘electronics’ in their title even if the companies had nothing to do with the electronics industry,” is reminiscent of the dot com and crypto boom decades later. Long Island Iced Tea anyone?1
These market darlings crashed in 1962, but the stock market recovered quite quickly. Because of this, the speculation continued, but with different market leaders managed by different fund managers. The hot new fund managers, who came to be known as “gunslingers,” put up eye-watering performance numbers in the late 1960s. Fred Mates’s fund, for example, was up 154% in 1968; Gerald Tsai’s fund was up 40% in 1967; Fred Carr’s Fund was up 118% in 1967 and another 45% in 1968.
Beneath these impressive numbers is the unimpressive fact that all these fund managers were buying the same stocks: conglomerates, aerospace companies, and “concept” stocks. The problem with momentum driven performance is that when the party ends, everyone heads for the exits of the same group of stocks at the same time. Sure enough, when interest rates rose from 4%-13% in response to inflation caused by President Johnson’s massive spending on the Vietnam War and a plethora of domestic social programs, conglomerate stocks declined on average 86%. “Concept” stocks fell a stunning 99%! Lockheed Martin fell from $70 in 1967 to $8 in 1970 to less than $3 in 1974.
Yet even these declining numbers could not tame the speculative spirit. While retail investors had gone through a world of hurt, their money was replaced by “smart” money. Pensions were rapidly growing, and this money was managed by those who believed that the best way to manage money was to buy the quality growth stocks, the ones that could grow no matter the economic environment. As Faber puts it, “what happened after the 1968-1970 bear market is that the fund managers of the rapidly growing institutional money endorsed with gusto the ‘quality growth stock concept’ and avoided investing in the broad market.”
Thus, in the early 1970s, there were in fact two markets that were headed in different directions: the beloved Nifty Fifty and everything else. Even though the price-to-earnings multiples of these darlings were north of 50x, investors convinced themselves that the high growth rates justified any price.
“The quality growth stocks were also praised at that time because of their companies’ ability to grow in good and bad times,
their strong management, their ability to innovate and dominate their markets, and their pricing flexibility.”
-Marc Faber
Their praise was not misguided. In many cases, investors were right about the growth – many of these companies did grow for many decades. Coca Cola, for example, grew earnings at 13.5% from 1972-1996. McDonald’s earnings grew at 17.5% for the same period!
Unfortunately, these positive fundamentals were not able to prop up these overpriced companies when the country went into a recession and inflation came roaring back. The Nifty Fifty corrected sharply and underperformed significantly. Investors, had they invested in 1972, made no money for more than a decade. Those who lost their nerve at the bottom lost on average 60%-80% of their money in the Nifty Fifty stocks in nominal terms and obviously more in real terms.
Importantly, it was possible to avoid the carnage and even do quite well during this difficult period. The stocks that did well during that decade were the real asset companies, which outperformed stocks and bonds, and had positive real returns.
Lessons from the 1970s
What might we want to take away from the 1970s experience?
- The first is that one should be worried about future returns when the crowd mistakes a high quality company for a high quality investment. They are not the same thing. Price matters. It is the most important determinant of performance over the long term. Unfortunately, when everyone flees to one pocket of the market, they end up sprinting towards investment risk. We have our doubts that today’s market darlings, the Magnificent Seven, will provide the returns investors are looking for simply because everybody owns them. We don’t know the future, but if the Magnificent Seven follow in the footsteps of the Nifty Fifty the performance of the stocks may diverge significantly from that of their companies. Investors could see themselves with substandard returns for decades. Imagine the 30-40 something who doesn’t break even until they are 60! (In real terms, of course.)
- Secondly, it is interesting to note that there are parallels to the attitudes of investors in the 1970s and today. As Faber puts it, “In the late 1960s and early 1970s, hardly anyone was concerned that inflation would become a major problem by the late seventies. Furthermore, in the early 1970s, no one, including the most bearish bond market strategists, expected interest rates to rise as much as they eventually did.” Inflation is volatile, and rarely goes up in a straight line. When inflation was dropping in the early 1970s, many believed, like many believe today, that inflation had run its course. Is 2023 the 1972 equivalent?
By the end of the 1970s, investors had come to believe the exact opposite; there was virtually no faith in the central banks’ ability to tame inflation. In 1981, investors could not be convinced to buy the 10-year treasury bond yielding almost 16%. Compare that to the indefatigable faith in central banks to thread the needle just right today. Today, it seems to be a foregone conclusion that they have succeeded. We have our doubts.
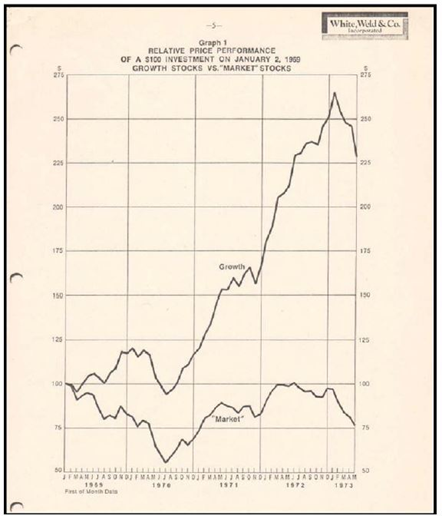
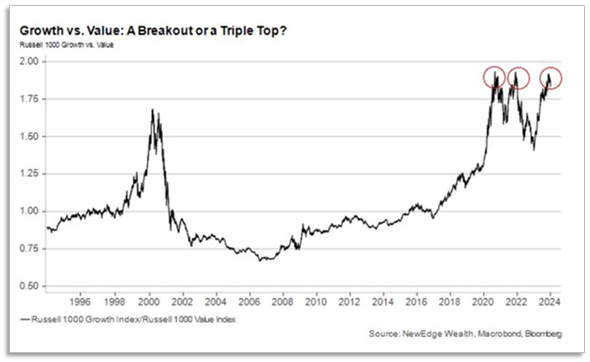
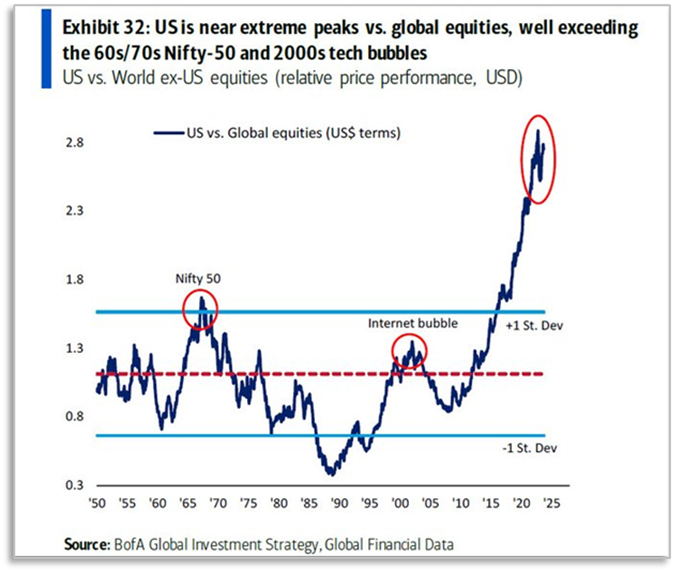
3. The third is that the leaders of one cycle are not the leaders of the next cycle (see chart below). Despite hundreds of examples of this, investors have a difficult time letting go of what has been working, fearing they will miss out. In 2023, the Magnificent Seven were up 75%, while the equally weighted index was only up 13%. It is difficult for many to avoid the party or leave early; doing so involves career risk, which is difficult for most to take. We, however, find little value in trying to squeeze the last bits of juice from an orange. We have been very public in our comments that one should think about the next forty years; we are unlikely to have another forty years like we just had.
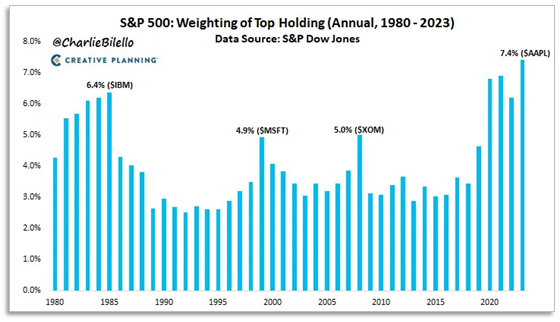
Apple alone comprises more than 7% of the S&P 500, the most of any stock at any time since 1980. (Source: Charlie Bilello, via Twitter)
We tip our hats to the very few who seem to be able to time these things. We cannot. We tend to invest early, and get out early, and we navigate markets several ways. We study history. Refuse to overpay. Diversify. Analyze. Appraise. Be patient. Think independently. Invest when the opportunities present themselves.
Kopernik’s Opportunities in a World of Debasing Currencies
Kopernik’s research process is 100% bottom up. We do not forecast what China’s GDP will do next year, for example, nor do we forecast what the CPI will register next quarter. We do, however, factor in what has already happened. The monetary base is up ten times in the last 20 years. Debasement of the currency over the last decade has happened at the fastest rate in recent history. Further, while not factored into our valuations, it seems highly likely that debasement will continue to happen as we run $2 trillion deficits (which could become larger if the Fed loses control of interest rates).
It has been a long time since the acronym MMT (modern monetary theory) has made the headlines. It seems to be generally accepted that debt and deficits don’t matter. We could not have predicted that the central banks would have been able to print as much as they did for as long as they did without suffering the consequences, but now it seems people don’t think there will be any consequences. The crowd’s expectations have moved from hard landing to soft landing to no landing. The central bank has mentioned the possibility of reducing rates next year. Is this coming from a place of strength? Have we tamed the inflation beast? Does currency debasement not matter? Does inflation of the money supply not lead to sustained inflation in prices? In memory of Charlie Munger, let’s invert. He often attributed his success to avoiding what was clearly illogical. Instead of predicting future CPI levels, let’s try to understand if prices stay level in an environment of monetary debasement.
A price can be viewed as a ratio; a unit of currency relative to a unit of stuff. Let’s say you double the number of dollars in the system, but don’t double the units of stuff. Does it make sense that the price, dollars/unit of stuff, stays the same? We believe that as long as the denominator isn’t able to easily double (that is, it is scarce) and it is something people need (that is, the demand is strong), the price will likely reflect the monetary debasement at some point in the future. It is a fool’s errand to try to predict when that price will rise; there are a lot of factors that go into that. We have found Richard Cantillon’s work to be helpful, which suggests that printing money is more akin to adding water to the headwaters of a river than filling up a bathtub. Money does not raise prices of things evenly nor at the same time; rather, the things closest to the source feel the money first. As money is injected into financial assets, financial assets do very well (for example, the 10-year treasury yield fell from 5% in 2007 to below 1% in 2020). Things bought with leverage, stocks, and real estate also do very well. Eventually these high prices bleed into the real economy; high real estate prices, for example, lead to demand and more investment in housing, leading to higher prices for building materials, contractors, basic labor, etc. People who borrow against their stocks and bonds are able to spend more, start new businesses, and so on.
Thus, a rising CPI index is a lagging symptom of the greater problem of monetary base inflation, or currency debasement. We would be surprised if the 10x increase in the monetary base led to only a 68% change in prices (the CPI increase from 2002-2023). After a year of interest rates being higher than 4%, and CPI coming down from 9% to 3%, the market seems to have bought the idea that inflation has been tamed. We note that while 3% is less than 9%, investors should be very worried that it has stayed as high as 3%, even as the prices of many commodities plunged. The Bloomberg commodity index peaked in May of 2022 and is 24% lower today. Commodities are just coming out of a very long bear market, and many prices are below the incentive price. It would be highly unlikely to see these prices stay at current levels for the long term.
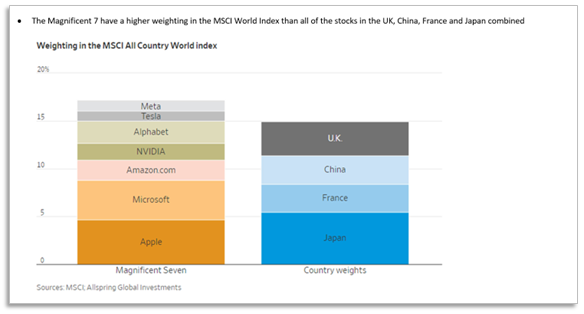
Yet, the market’s confidence in the ability of central bankers to put out the fires (that they themselves created) is unwavering. Because the market believes inflation has run its course, real asset companies, the companies that would benefit from an inflationary environment, are some of the lowest priced securities available. Like the gunslingers and Nifty Fifty managers of the 1970s, many are hanging on until the 11th hour for fear of missing out and own the same stocks. The Magnificent Seven now have a higher weighting than all of the stocks in the UK, China, France and Japan combined! The amazing performance of these stocks has whetted the appetite for more risk assets. The speculation has now broadened to more risky assets. There is no fear. We think there should be. Inflation will hit high duration stocks and bonds. We believe it is important to own undervalued securities always, and today, it is fortuitous that the companies that are the cheapest are also the ones that will benefit from the massive amount of money printed.
Top Conviction Areas
Gold Miners
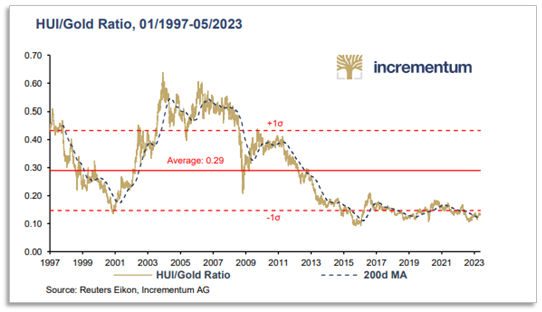
The market finds AI exciting; gold, uninteresting; gold miners, uninvestable. Relative to gold, the gold miners have traded at one standard deviation below the mean for 8 years. Gold is now trading at the highest level EVER, and gold miners are still down 50%-75% from 2011.
We concede that the miners have deserved some of this punishment – the mining companies are famous for their poor corporate governance and their horrible capital allocation decisions. In the years leading up to 2011, the mining executives levered up their balance sheets and paid up for marginal assets, many of which were reversed and sold off at the bottom of the cycle in 2014-2015. Impairments between 2012-2017 totaled $129bn2! CEOs were fired; and a new crop of CEOs, vowing not to make the same mistakes again, have compounded the problem as they have made the opposite mistake, failing to take advantage of the bear market to replace and grow their reserves at very cheap prices. Sigh.
As shareholders, maybe we should just be grateful that they are not actively destroying value at the moment. If they continue on the path of mining their existing resources at current prices, investors should make money. If gold reverts to a more normal ratio to the monetary base, the gold miners should rip much higher. We have had many false starts (2016 and 2020), but these episodes show how quickly sentiment can change. This sort of asymmetry (limited downside with virtually free optionality) is a value investor’s dream. We believe the gold miners will follow the trajectory of the uranium miners.
Uranium Mining Companies
Uranium mining companies have been in our portfolio since our inception in 2013. The fundamentals clearly pointed to higher uranium prices; mine supply was well below demand and low prices were causing mines to shutter rather than start. This was especially the case in 2016-2017 when uranium prices were hovering around $20/lb., roughly a quarter of our estimated incentive price. In January of 2018, Cameco Corp (“Cameco”) closed one of the world’s highest grade uranium mines. Fortunately, this long lull allowed us to increase the portfolio’s investment in the space at lower and better prices. With demand stable to growing, it was not possible for this dynamic to go on forever.3
Forever no, but 8 years is a long time to wait! Uranium mining companies finally moved in 2021, and the rally continued in 2023 after a flat to down year in 2022. Between 2020 and end of 2023, Cameco went from $5.50 to $43.60 per share, NexGen Energy Corp’s price increased from $0.55 to $6.93, and NAC Kazatomprom JSC (“Kazatomprom”) went from $11.40 to $42.45.
Conviction is difficult to maintain in a long bear market. One needs an anchor and a compass. Fundamental analysis prevents us from getting lost at sea. But the uncertain timing is often too high a hurdle for many investors to clear, and, unfortunately, the preference for certainty comes at the expense of long-term performance.
According to our analysis, there is remaining upside in uranium holding companies such as the Sprott Physical Uranium Trust and Yellow Cake PLC. There is also still upside in Kazatomprom, which says more about investors’ preference for developed markets than the quality of the company. Kazatomprom is the largest and lowest cost uranium producer globally. We continue to hold a sizeable position; meanwhile, we have trimmed and eliminated others. The wait was difficult, but the return on patience was double digit IRRs.
Emerging Markets
In addition to real assets, as discussed previously, emerging markets are selling at bargain prices. Emerging markets are not a niche; they are half of the world. They are 76% of global land, 87% of the global population, and 42% of global GDP. Yet there are still investors who won’t touch emerging markets as they are deemed too risky. There are two issues we see with this stance: 1) it is a dangerous thing to make such a generalization about half of the world’s economy; and 2) the prices for high quality companies in emerging markets make them less risky, not more.
To the first point, let us take South Korea as an example. Though a developed market according to the FTSE, it has been labeled an emerging market by MSCI. As such, the market says “risky” and throws on an emerging market discount. Yet South Korea is more similar than dissimilar to a developed market. South Korea’s GDP (in purchasing power parity terms) is the same as that of the European Union, and South Korea is the world’s fifth-easiest country in which to do business, according to the World Bank. South Korea ranks higher than the U.S. in educational outcomes and life expectancy and has a lower poverty rate and lower budget deficit as a percentage of GDP. To make a generalization about emerging markets is to say that South Korea and Saudi Arabia are one in the same. There are obvious and important differences between the two. As to the second point, many South Korean companies are trading at huge discounts to their counterparts in the U.S. Kopernik’s South Korean portfolio holdings are high quality franchises and are trading at less than half of book value and low multiples of cash flow. Does this make them more risky? We think not. The risk of losing money permanently is vastly lower when pessimism is highest. As Benjamin Graham points out, “The intelligent investor is a realist who sells to optimists and buys from pessimists.” Generally emerging market stocks are more volatile, but to an active, long-term investor, volatility is a beautiful thing. Volatility provides opportunities to buy at better prices.
While volatility as risk is a misperception in the market that we capitalize on, we agree with the market that there is more geopolitical uncertainty in emerging markets. Larger amounts of uncertainty necessitate larger margins of safety. Thus, it makes sense to invest in emerging markets when only the risks are top of mind rather than the opportunities. Such is certainly the case now. Perhaps there is no better demonstration of extreme optimism and pessimism than to compare the Magnificent Seven (a market cap of $12.1 trillion) with China (a market cap of $10.6 trillion):
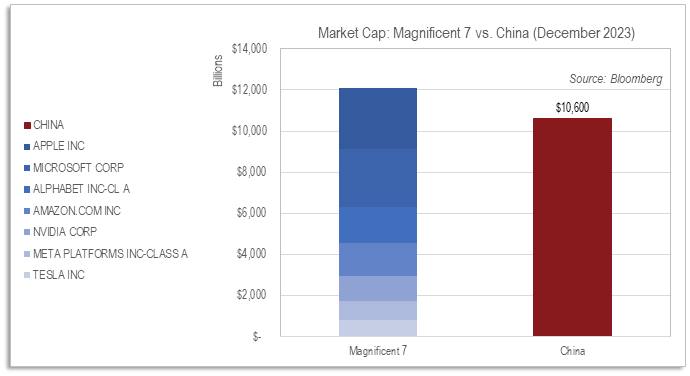
As you can see from the chart above, one can take their hard-earned money and buy 7 beloved stocks or take less of their hard-earned money and buy every single company in the world’s largest economy (on a PPP basis). As an active investor, it is even better. You can take your hard-earned money and buy only the best bargains. Kopernik has identified mispricings in China. For example, its largest pharmaceutical distributor trades at only 6% of sales, 2.5 times lower than that of U.S. medical device distributor McKesson Corp. China’s largest nuclear utility has an enterprise value/megawatt of capacity of 4, which 40% less than that of Constellation Energy Corp’s nuclear assets. And the railroad that connects three of China’s largest population centers (Hong Kong, Guangzhou, and Shenzhen) trades at 1/10th of Union Pacific Corp on a price-to-book basis.
If past experience is any help on timing, the market will likely come around to our way of thinking quickly on some opportunities and painfully slowly on others. Uranium was an example that showed how well patience paid off. We anticipate gold will be the same. It appears that many other producers of gold and other commodities, and many quality businesses domiciled in emerging markets are poised to deliver similar returns in the future. Emerging markets have experienced wild swings in investor psychology over the last 15 years moving from “must own” to “must avoid.” For most, it is easy to stay on a course that has been working. The U.S. momentum market is on a roll. However, it may be time to sell to optimists and venture to less loved areas of the market. Thankfully, the team at Kopernik is having no trouble finding these.
Hope everyone had a wonderful holiday season, and we wish you all the best in 2024.
Alissa Corcoran, CFA
Deputy Chief Investment Officer
January 2024
Important Information and Disclosures
The information presented herein is proprietary to Kopernik Global Investors, LLC. This material is not to be reproduced in whole or in part or used for any purpose except as authorized by Kopernik Global Investors, LLC. This material is for informational purposes only and should not be regarded as a recommendation or an offer to buy or sell any product or service to which this information may relate.
This letter may contain forward-looking statements. Use of words such was “believe”, “intend”, “expect”, anticipate”, “project”, “estimate”, “predict”, “is confident”, “has confidence” and similar expressions are intended to identify forward-looking statements. Forward-looking statements are not historical facts and are based on current observations, beliefs, assumptions, expectations, estimates, and projections. Forward-looking statements are not guarantees of future performance and are subject to risks, uncertainties and other factors, some of which are beyond our control and are difficult to predict. As a result, actual results could differ materially from those expressed, implied or forecasted in the forward-looking statements.
Please consider all risks carefully before investing. Investments in a Kopernik strategy are subject to certain risks such as market, investment style, interest rate, deflation, and illiquidity risk. Investments in small and mid-capitalization companies also involve greater risk and portfolio price volatility than investments in larger capitalization stocks. Investing in non-U.S. markets, including emerging and frontier markets, involves certain additional risks, including potential currency fluctuations and controls, restrictions on foreign investments, less governmental supervision and regulation, less liquidity, less disclosure, and the potential for market volatility, expropriation, confiscatory taxation, and social, economic and political instability. Investments in energy and natural resources companies are especially affected by developments in the commodities markets, the supply of and demand for specific resources, raw materials, products and services, the price of oil and gas, exploration and production spending, government regulation, economic conditions, international political developments, energy conservation efforts and the success of exploration projects.
Investing involves risk, including possible loss of principal. There can be no assurance that a strategy will achieve its stated objectives. Equity funds are subject generally to market, market sector, market liquidity, issuer, and investment style risks, among other factors, to varying degrees, all of which are more fully described in the fund’s prospectus. Investments in foreign securities may underperform and may be more volatile than comparable U.S. securities because of the risks involving foreign economies and markets, foreign political systems, foreign regulatory standards, foreign currencies and taxes. Investments in foreign and emerging markets present additional risks, such as increased volatility and lower trading volume.
Kopernik continues to monitor and comply with executive orders surrounding certain companies of the People’s Republic of China.
The U.S. government and many other countries have imposed economic sanctions on certain Russian individuals and Russian corporate and banking entities. Kopernik continues to monitor such sanctions and are taking necessary actions to ensure compliance with applicable sanctions, laws, and regulations.
The holdings discussed in this piece should not be considered recommendations to purchase or sell a particular security. It should not be assumed that securities bought or sold in the future will be profitable or will equal the performance of the securities in a Kopernik portfolio. Current and future portfolio holdings are subject to risk.
- Long Island Iced Tea Corp changed its name to Long Blockchain Corp in 2017. The stock went up 380%. ↩︎
- McKinsey & Co., “Can the gold industry return to a golden age: Digging for a solution to the gold mining reserve crisis?” February 2019. ↩︎
- The uranium mining stocks struggled during this period as uranium prices kept mine production low. For example, Cameco went from $22.20 in 2013 to $5.50 in 2020; NexGen went from $3.13 in 2017 to $0.55 in 2020. We discuss our thesis further in a series of uranium whitepapers, all of which are available on our website. ↩︎