Timber (Jun 2026)
Seeing the Trees, Missing the Cycle
The price of timber is rarely on anyone’s mind. It appears indirectly, in the cost of a Christmas tree, a kitchen renovation, a shipping box, a package of tissues, or a box of diapers. Most people encounter timber only after it has been harvested, processed, transported, and transformed into something familiar. By then, the forest has disappeared from view, and all that remains is a small cluster of tree-based products.

Markets often make similar mistakes valuing cyclical companies; extrapolating instead of normalizing, markets often invest procyclically. Timber is long-duration and biological; it grows on its own schedule. Its price, however, is cyclical and regional, shaped by housing demand, pulp markets, mill capacity, transportation logistics, weather, and harvest decisions. At the low end of the cycle, earnings may look weak even as the assets retain substantial value.
Such is the case today. The forest has been growing quietly for many years. Many timber-exposed companies trade near prices seen fifteen years ago, despite years of biological growth, stable demand, and monetary expansion that have lifted many other asset categories. The market appears to be mistaking cyclical weakness for an industry in decline (we grant, however, that it has been a LONG cycle). As anyone who has spent time walking through the woods can attest, the forest may be quiet, but it is not idle. Trees continue to grow, inventories continue to mature, and land continues to carry value even when prices are weak and investor attention has moved elsewhere.
This idea runs through this paper and returns in the conclusion: reality does not wait for observation. Timber markets are built on biology as much as economics. Trees take years to grow, land is finite, and weather and policy ripple through supply and pricing. At Kopernik, we’re seeing opportunities emerge from that complexity and identifying mispricings across the timber landscape, and we’ve been adding select timber-exposed companies to the portfolio in recent months. This whitepaper steps back from the trees to look at the forest: how the market is structured, what drives supply and demand, where pricing dislocations can arise, and how Kopernik takes advantage of those.
Global Timber Market Overview and Demand Fundamentals
Timber underpins daily economic activity across the globe. In developed markets, it is fundamental to residential construction, renovation, furniture, packaging, and paper products. In emerging economies, roughly half of all harvested wood is still used as fuelwood or charcoal, providing basic household energy for billions of people. As a result, timber demand is tied not only to GDP growth and housing cycles, but also to population growth, urbanization, and living standards.
The global timber industry is a trillion‑dollar sector, spanning forestry, logging, lumber manufacturing, wood‑based panels, pulp and paper, and biomass energy. Each year approximately 4 billion cubic meters of wood are harvested worldwide making timber one of the largest physical commodity flows in the global economy. Unlike most extractive resources, timber is biologically renewable: trees regrow, forests regenerate, and productive land can yield repeated harvests over multiple generations.
Timber production is globally dispersed. The United States is the largest timber producer in the world, harvesting roughly 500 million cubic meters per year, with production anchored in two key regions: the Southeast and Pacific Northwest. Canada contributes over 300 million cubic meters per year; as a British Commonwealth nation, most of its land is crown-owned, which introduces nuances in land use and ownership (most timber companies operate under long-term lease agreements rather than land ownership). China is both a major timber producer and the world’s largest consumer of wood and wood products; Russia has historically been a major exporter of softwood logs and lumber, particularly to China and other Asian nations. Northern Europe, especially Sweden and Finland, also has significant timber production. In South America, Brazil and Chile are among the most important plantation-based timber producers, and Brazil’s eucalyptus plantations supply a dominant share of the world’s pulp exports.
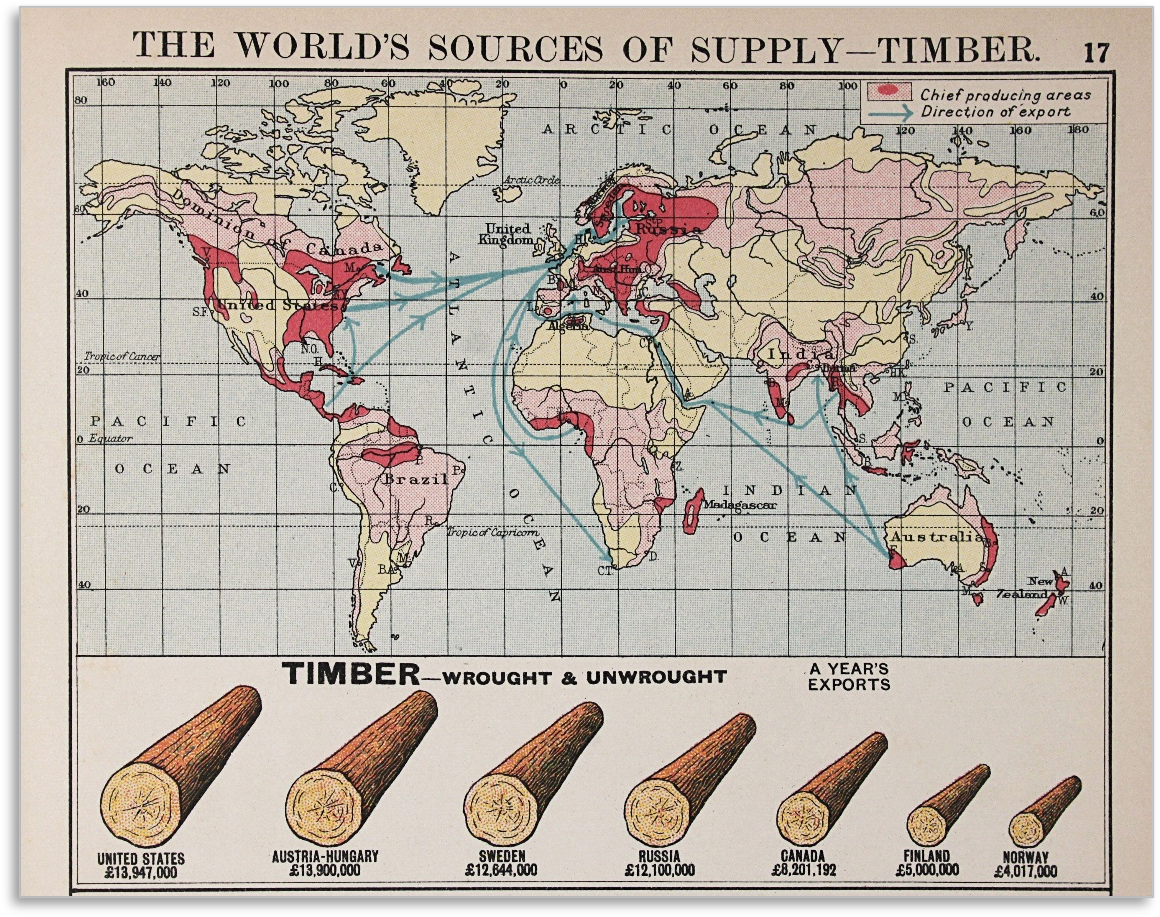
This image is from the 1912 Philip’s Chamber of Commerce Atlas.
Regional Timber Dynamics
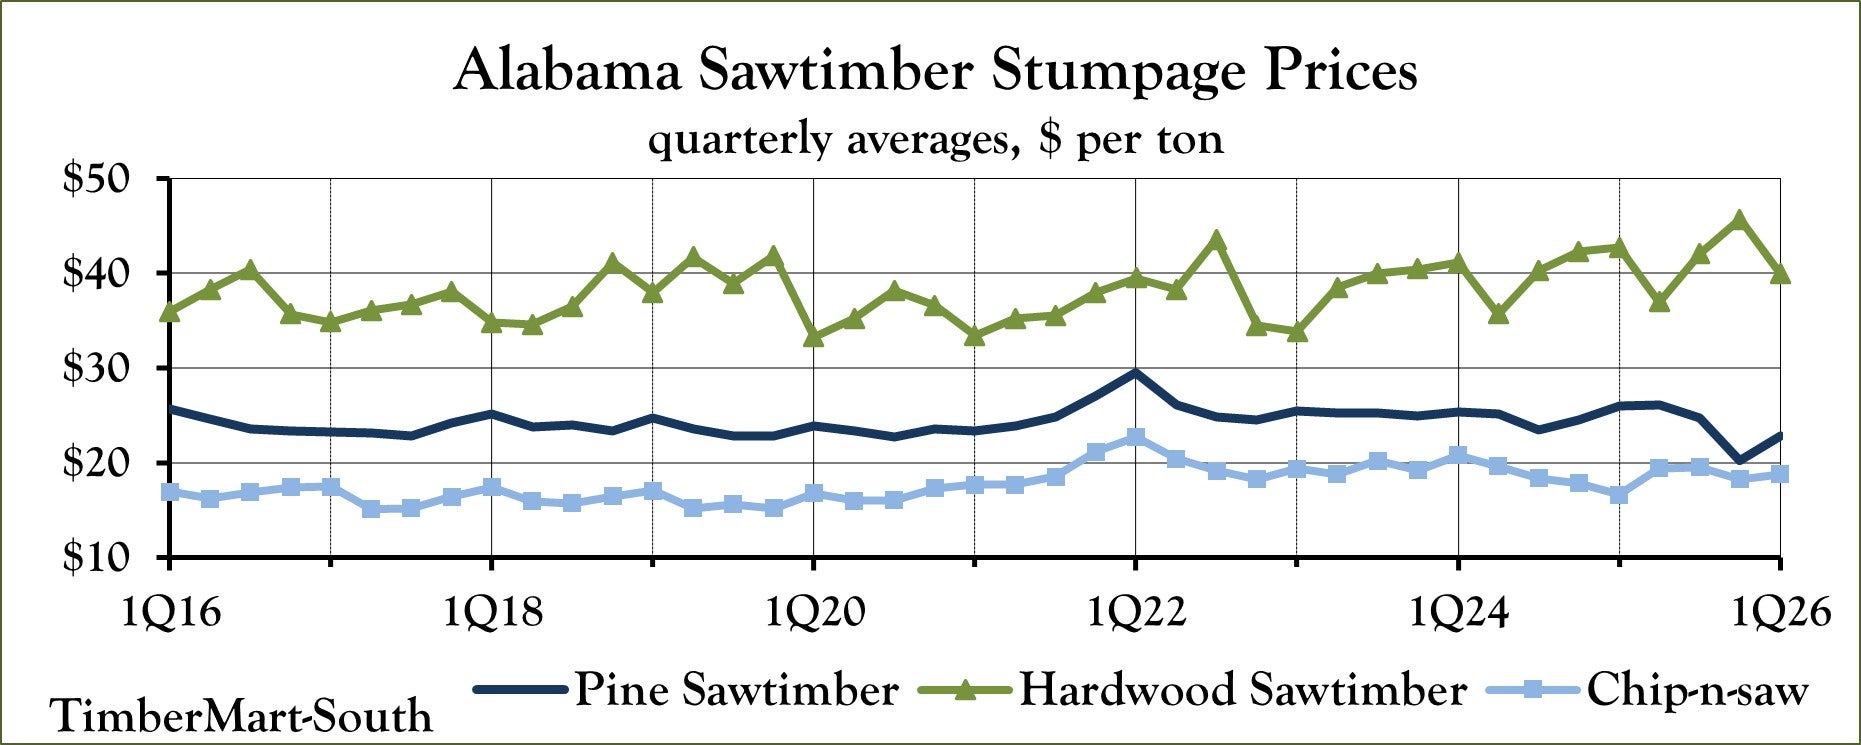
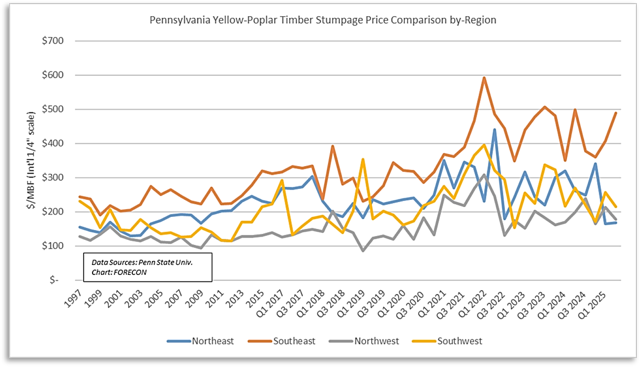
Wood is costly to transport relative to its value, so logs are usually processed near where they are grown. That makes regional mill capacity, haul distances, and local infrastructure central to pricing. Stumpage (the market value of trees “still on the stump”) is set by highly local supply‑demand conditions, and location matters not only for land values but for the economics of converting standing inventory into realized cash flow. The next two charts highlight the point that timber pricing is inherently regional:
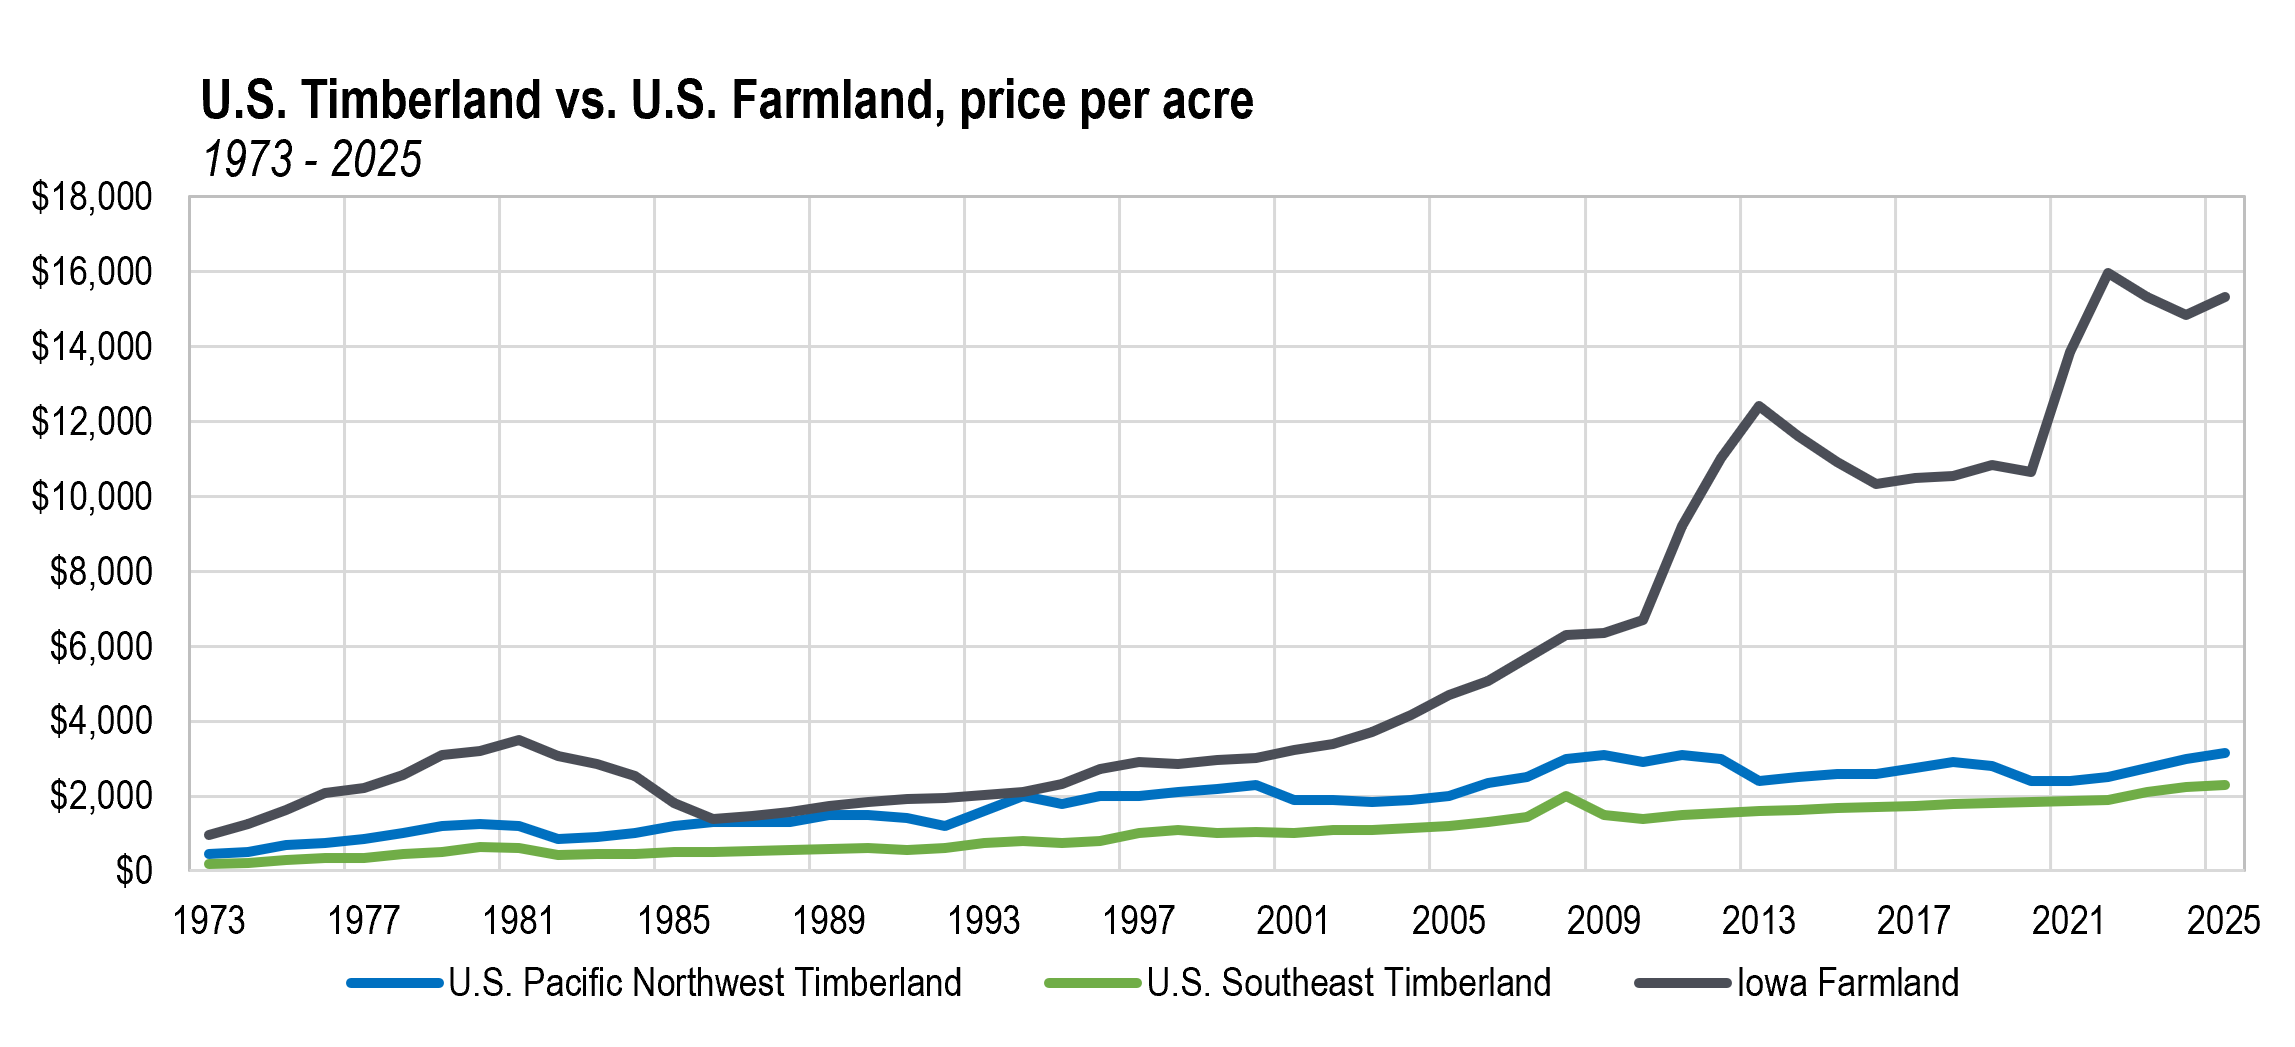
It is also important to separate asset value from cycle timing. Lumber (and therefore stumpage) appears to be towards the low end of the cycle today. This is especially relevant for vertically integrated companies with additional business segments: when pricing is weak, reported earnings can understate normalized cash generation, and the market often assigns little value to the embedded option of harvesting later into a stronger price environment. In our view, the combination of a large landbank and hard-to-replicate vertical integration meaningfully strengthens replacement economics and is a central input to how we value these businesses. Agricultural land provides a useful comparison. History suggests the U.S. market has rewarded agricultural land more consistently than U.S. timberland. U.S. farmland has outperformed U.S. timberland by a wide margin since the early 1990s, despite their similarities. Put differently, timber’s current lack of market attention is not the same as a lack of underlying asset value. Instead, it is a reminder that productive land categories can diverge for long stretches when cycles, incentives, and demand move out of sync.
That divergence has shown up vividly in the U.S. Southeast, where today, farmland and pastureland trade at a substantial premium to timberland. In the 1980s, the region saw the reverse. Driven by high returns, which incentivized the conversion of agricultural land to forest land, timber planting in the 1980s and 1990s helped set up the oversupply that persists today. Policy incentives amplified the cycle: the U.S. Department of Agriculture’s Conservation Reserve Program (CRP), established in the 1985 farm bill, paid landowners to take cropland out of production and establish long-term conservation cover, including tree planting. Across parts of the South, many marginal row-crop acres were converted into pine plantations, improving near-term economics for landowners but contributing, over time, to oversupply, or what industry participants often describe as a “wall of wood.”1
The result was a prolonged oversupply measured by a growth‑to‑drain imbalance. In simple terms, a ratio of 1.0x means the forest is in balance: harvest equals biological growth. A ratio above 1.0x means growth is exceeding harvest, inventories are building, and supply remains loose; a ratio below 1.0x would indicate that inventories are being drawn down and supply is tightening. By that measure, the current U.S. South ratio of roughly 1.4x means that the market is still oversupplied but is improving. Current forecasts suggest it could fall further, to roughly 1.2x by 2030.
The growth-to-drain ratio reflects more than just planting and harvests, however. Mill capacity also matters; logs are local and uneconomic to transport long distances. As discussed above, in the U.S. South, a large planting wave in the 1990s and early 2000s increased timber supply just as the Global Financial Crisis weakened housing and pulp demand. As a result, a significant amount of downstream mill capacity closed. If mills close in a region, effective demand for that wood falls even if the trees are still standing. Regional averages can obscure important differences. The 1.4x ratio described above is an average across the South; some subregions remain materially more oversupplied, particularly in sawtimber, while other areas are closer to balance once pulp demand is considered. In the U.S. Pacific Northwest, the ratio has remained around 1.0x for many years due to limitations on harvesting on federal land; the wood exists but is not included in the potential harvestable supply. Private timberland owners in that region harvest close to what their land grows so as not to leave capital on the stump. Regional differences are also present in Scandinavia; Finland’s growth-to-drain ratio of 1.1x is closer to balance, while the ratio in Sweden sits at 1.4x. Interestingly, Sweden has built forest stock continually for the last hundred years, with overall stock doubling since 1923. This is in large part because of the country’s forestry laws, which require planting 1.5-4 seedlings for every tree cut.
Softwoods vs. Hardwoods: Species, Products, and End Markets
Timber is best understood through the distinction between softwoods and hardwoods. While instinctively we might think that softwoods are used to make paper and pulp products and hardwoods are used to make lumber and building products, the reverse is true. Softwoods, which come from coniferous trees (particularly evergreens), are used primarily in structural lumber and construction products, while hardwoods are more closely tied to fiber markets (pulp, paper, and packaging) and select higher value uses where appearance and finish matter (for example, cabinetry).
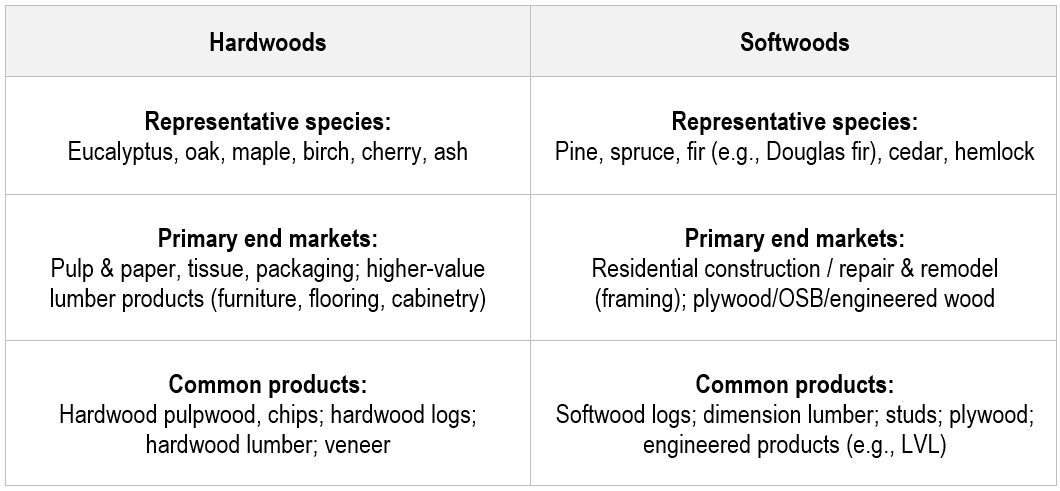
Timber’s versatility supports a broad range of end markets. Construction is the largest commercial use of timber in developed markets; other specialty uses include furniture, flooring, cabinetry, and musical instruments. Roughly 20% of harvested wood is converted into pulp for paper, tissue, and packaging. While demand for certain paper products has declined, packaging and hygiene products have stabilized overall consumption, particularly with the rise of ecommerce. Retail giant Amazon has worked over the last few years to reduce plastic packaging, turning instead to paper: according to the company’s 2024 sustainability report, 56% of their North American distribution centers use no plastic packaging.
Globally, about half of all wood harvested is used for energy. This is the case in emerging economies, where a large share of total household energy consumption comes from burning wood in stoves or open fires; it is also the case in developed economies which use wood biomass as a component of their renewable energy mix. In the European Union, roughly 60% of renewable energy (11% of total energy supply) in 2022 came from biomass.2
The use of timber for energy highlights wood’s place at the center of sustainability debates. Poorly managed logging contributes to deforestation, biodiversity loss, and carbon emissions; well-managed forests are renewable assets that sequester carbon and support ecosystems. Timber differs from many other extractive industries: forests regenerate, and young, growing trees actively absorb CO₂.
To summarize, the timber market is best framed by a small set of recurring dynamics:
- Diversified demand; pricing is set depending on product, region, and point in the cycle.
- Supply adjusts slowly because growth takes years and productive acreage is constrained.
- Markets are regional; tree species, rotations, and mill capacity drive different cost curves and price realizations by geography.
- Slow supply and cyclical demand create periodic dislocations that can move prices sharply, creating opportunities for investors.
Collectively, these characteristics indicate that timber is not well served by valuation approaches that rely on spot prices or single‑cycle earnings multiples. A more appropriate framework is asset‑based and explicitly incorporates regional market structure, biological growth, and cyclical end‑market conditions.
Timber Valuation Framework
In timber companies, we tend to look for the following:
- Large landbanks, either owned or with long leases under acceptable terms
- Proximity to markets or transportation hubs
- Strong management teams that are incentivized appropriately
- Strong balance sheet
- Good safety and environmental track record
In our view, what matters most is land ownership: how much timberland does a company own, and how productive is that land? To that end, we value timber companies using a land-first, money-supply-aware approach. As with valuing agriculture producing companies, our timber valuation is anchored on the enterprise value per acre (EV/Acre) metric. Kopernik finds scenario analysis useful in guiding our valuation model; we build a probability-weighted valuation using recent transactions, a scenario that incorporates money-supply growth, and a bear case based on current market prices. The objective is to establish a conservative estimate of per acre intrinsic value. From there, we apply a margin of safety to account for the risks. In our view, biological risk (pest, disease, contamination) is the key risk to this industry; policy risk, access to water, and environmental risk (fire, hurricane) are also important.
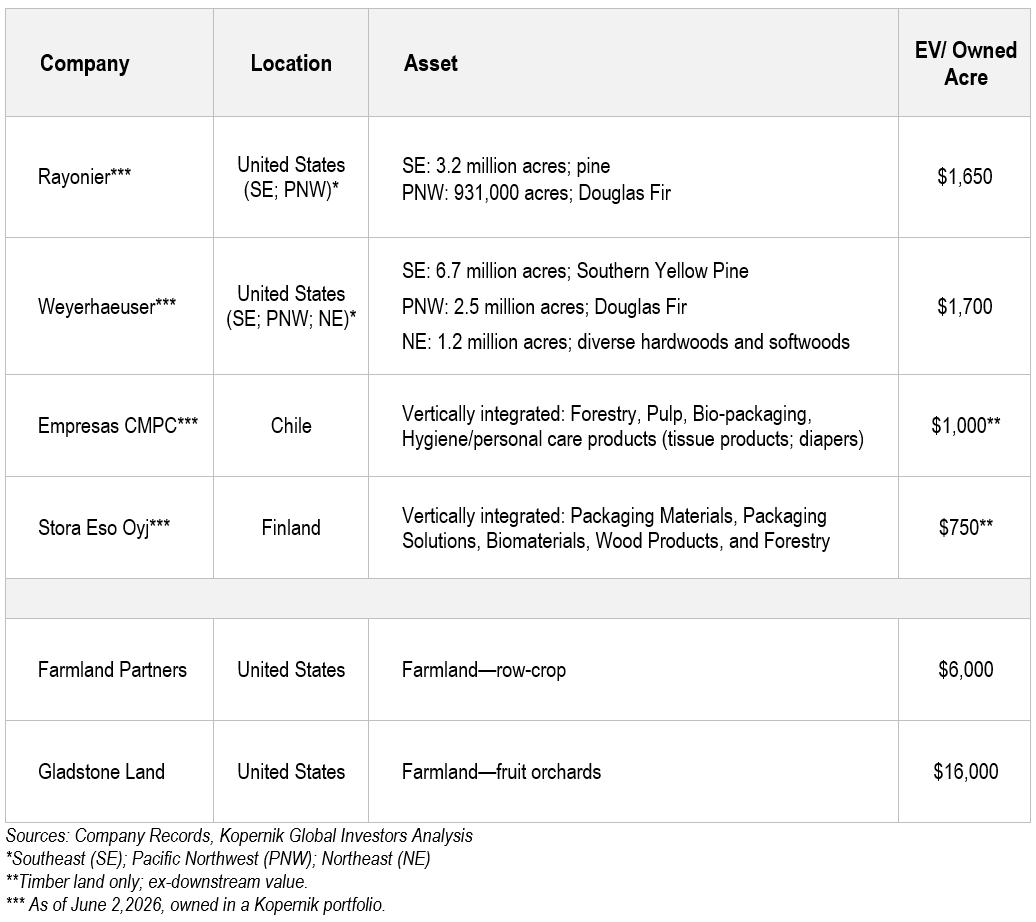
As a sanity check, we can compare private-market timberland transactions in the U.S., which have generally cleared at values well above where several public timber-exposed companies trade today on an EV/acre basis. (Since 2019, the average transaction in Pacific Northwest timberland has been roughly $4,600/acre; the average Southeast transaction has been $2,470.) In other words, the private market for the underlying land has been pricing timberland at levels that imply a meaningfully higher value than is reflected in public markets and the stock prices of timber companies.
Utilizing this valuation framework, we have recently added several timber companies to the portfolios. Below is a table describing these companies; we’ve also shown two farmland companies for comparison.
Conclusion: Does it make a sound?
In Tampa, Florida, where Kopernik is based, live oaks go through a brief season each year when they look dead, shedding old leaves, releasing pollen, and then pushing new growth. It wouldn’t be far-fetched for an observer to think the tree was dying. And yet, it isn’t. It’s just at a low point in the greenery cycle. The absence of evidence is not evidence of absence. A process can be underway long before it becomes obvious.
If a tree falls in the forest, and no one is around to hear it, does it make a sound? It’s an old philosophical question about observation versus reality, about whether something “matters” only once it is noticed. The world does not wait for our attention: the tree falls either way. We often learn about it later, by its consequences.
Markets have their own version: If the government prints a trillion dollars overnight, but no one acknowledges it, does it make a sound? In our view, yes, because money printing is inflationary, and the effects show up over time.
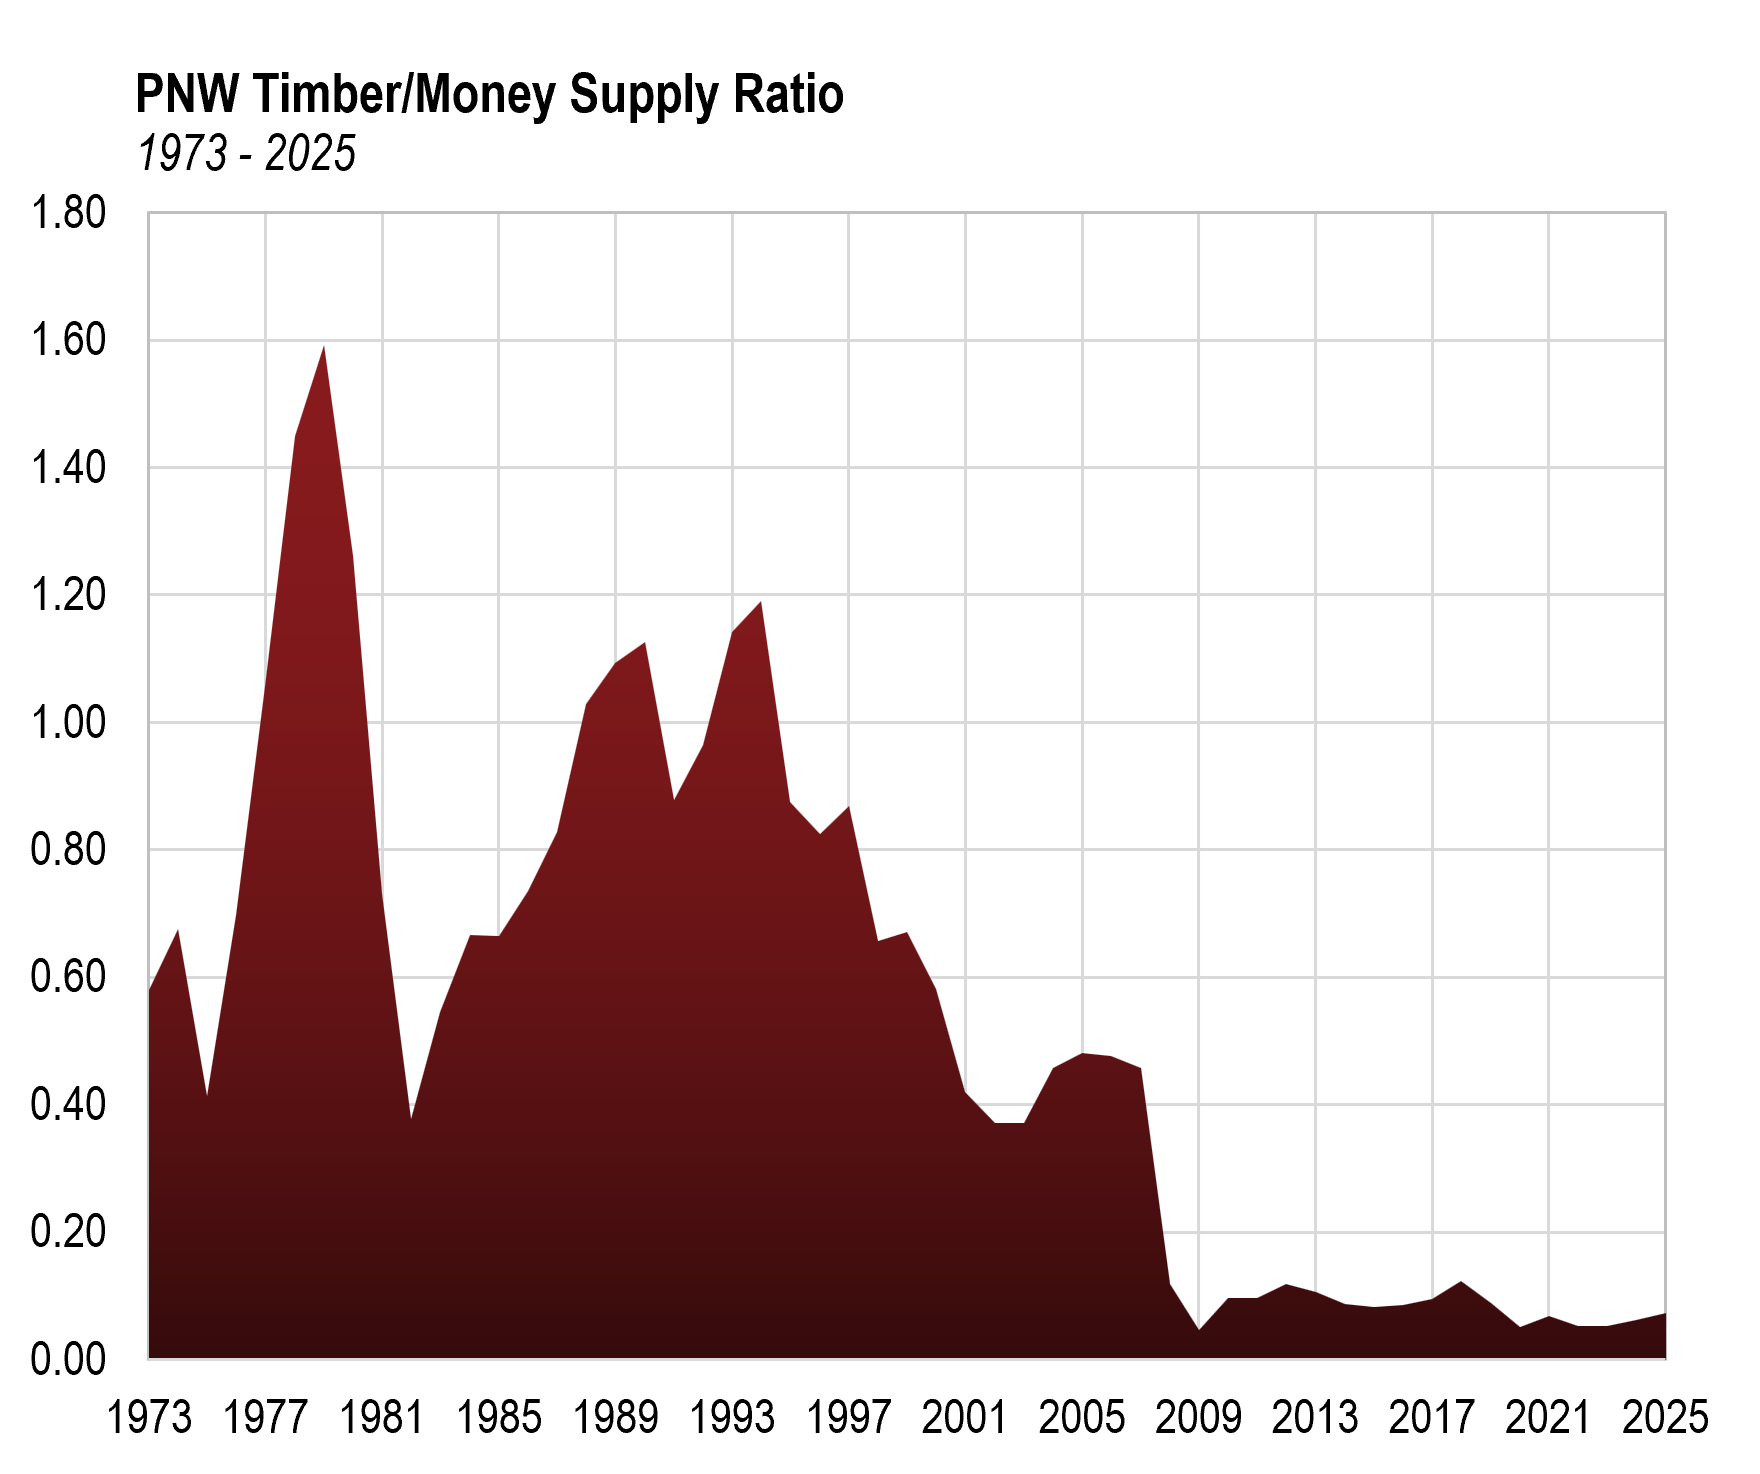
Such is the likely case with timber. Despite substantial monetary expansion since 2008, listed timberland values and timber‑exposed equities have not appreciated commensurately and are trading at levels comparable to those seen nearly two decades ago. One way to interpret this disconnect is through the Cantillon effect, described by eighteenth-century Irish French economist Richard Cantillon: newly created money does not enter the economy evenly. In practice, liquidity often shows up first closest to the source (financial assets) while real assets can lag.
Timber sits squarely in that latter category. Timberland values are set in private transactions, and timber pricing is realized locally through harvest decisions, mill capacity, and logistics. As a result, it is likely that a meaningful portion of post‑2008 monetary expansion has not yet flowed through to timber in a consequential way. Timber is trading at historic lows to the money supply, as seen in the chart below:
The “sound” depends on where the new money lands first. The Cantillon effect reminds us that money creation is not neutral. Liquid financial assets often reprice before real assets. Market recognition can lag. For bottom-up investors, that lag is the opportunity. If the market is slow to “hear” the change, we are content to own assets that can (literally) grow while we wait.
As always, thank you for your support.
Taylor McKenna, CFA, Metals & Mining Analyst
written in conjunction with Mary Bracy, Managing Editor – Investment Communications
Production and Design:
John W. Braukman IV, Marketing Manager
Alaukika Vaishnav, Marketing Specialist
July 2026
- For more on this, see The Wall Street Journal, Thousands of Southerners Planted Trees for Retirement. It Didn’t Work. October 9, ↩︎
- IEA, Implementation of bioenergy in the European Union – 2024 update. ↩︎
Important Information and Disclosures
The information presented herein is proprietary to Kopernik Global Investors, LLC. This material is not to be reproduced in whole or in part or used for any purpose except as authorized by Kopernik Global Investors, LLC. This material is for informational purposes only and should not be regarded as a recommendation or an offer to buy or sell any product or service to which this information may relate.
This letter may contain forward-looking statements. Use of words such was “believe”, “intend”, “expect”, anticipate”, “project”, “estimate”, “predict”, “is confident”, “has confidence” and similar expressions are intended to identify forward-looking statements. Forward-looking statements are not historical facts and are based on current observations, beliefs, assumptions, expectations, estimates, and projections. Forward-looking statements are not guarantees of future performance and are subject to risks, uncertainties and other factors, some of which are beyond our control and are difficult to predict. As a result, actual results could differ materially from those expressed, implied or forecasted in the forward-looking statements.
Please consider all risks carefully before investing. Investments in a Kopernik strategy are subject to certain risks such as market, investment style, interest rate, deflation, and illiquidity risk. Investments in small and mid-capitalization companies also involve greater risk and portfolio price volatility than investments in larger capitalization stocks. Investing in non-U.S. markets, including emerging and frontier markets, involves certain additional risks, including potential currency fluctuations and controls, restrictions on foreign investments, less governmental supervision and regulation, less liquidity, less disclosure, and the potential for market volatility, expropriation, confiscatory taxation, and social, economic and political instability. Investments in energy and natural resources companies are especially affected by developments in the commodities markets, the supply of and demand for specific resources, raw materials, products and services, the price of oil and gas, exploration and production spending, government regulation, economic conditions, international political developments, energy conservation efforts and the success of exploration projects.
Investing involves risk, including possible loss of principal. There can be no assurance that a strategy will achieve its stated objectives. Equity funds are subject generally to market, market sector, market liquidity, issuer, and investment style risks, among other factors, to varying degrees, all of which are more fully described in the fund’s prospectus. Investments in foreign securities may underperform and may be more volatile than comparable U.S. securities because of the risks involving foreign economies and markets, foreign political systems, foreign regulatory standards, foreign currencies and taxes. Investments in foreign and emerging markets present additional risks, such as increased volatility and lower trading volume.
The holdings discussed in this piece should not be considered recommendations to purchase or sell a particular security. It should not be assumed that securities bought or sold in the future will be profitable or will equal the performance of the securities in this portfolio. Current and future portfolio holdings are subject to risk.
Commodities may be affected by changes in overall market movements, changes in interest rates, and other factors such as weather, disease, embargoes, or political and regulatory developments, such as trading activity of speculators and arbitrageurs in the commodities. Investing in commodities entails significant risk and is not appropriate for all investors.
To determine if a Kopernik Mutual Fund is an appropriate investment for you, carefully consider the Fund’s investment objectives, risk factors, charges and expenses before investing. This and other information can be found in the Fund offering materials, which may be obtained by contacting your investment professional or calling Kopernik Mutual Fund at 1-855-887-4KGI (4544). Read the offering materials carefully before investing or sending money. Check with your investment professional to determine if a Kopernik Mutual Fund is available for sale within their firm. Not all funds are available for sale at all firms.